The Great Pivot Delusion

Needless to say, the March CPI, which sharply cooled to 5.0% Y/Y from the 8.9% peak posted last June, got a mega-boost from plummeting energy prices.
In fact, the CPI for gasoline (red line) swung violently south. After rising by +59.6% on a Y/Y basis last June, it reversed into a -17.4% decline versus prior year in March.
At the same time, however, the so-called sticky CPI (yellow line) was heading in the opposite direction. The Y/Y gain of 5.4% last June was up by 6.5% in March and shows no signs of reversing.
What that means, of course, is that as energy prices head northward again, the headline CPI number will remain high and sticky. The presumed steady march downward toward the Fed’s 2.00% target simply isn’t going to happen any time soon.
Y/Y Change In CPI for Gasoline Versus Sticky Price CPI, June 2022 to March 2023

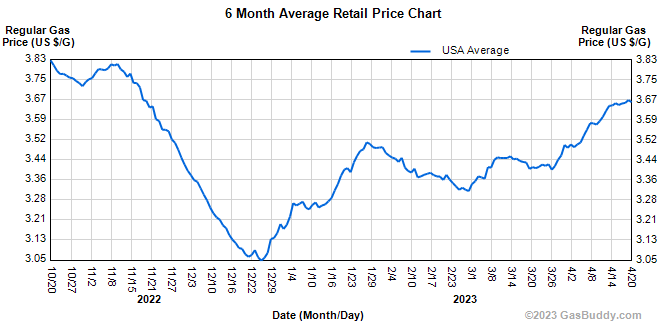
In fact, gasoline prices have been irregularly heading higher since the December 2022 interim bottom. According to the Gas Buddy national index, the average pump price now stands at $3.67 per gallon, up 20% from the $3.06 per gallon level reported in December and 10% from the end of February.
By contrast, the CPI for gasoline in March was actually 1.3% below its December level. That it to say, the CPI lags the real world gasoline price trends by a few months. But sooner or later it catches up—so in the period just ahead it will be rising, putting renewed upward pressure on the headline CPI index.
What is lurking in the shadows, of course, is the “S” word—stagflation. Going forward employment and real GDP will continue to weaken and eventually rollover into recession, while inflation remains stuck well above anything remotely tolerable—either from a normative point of view or even the Fed’s paint by the numbers monetary algorithms.
Keep reading with a 7-day free trial
Subscribe to David Stockmans Contra Corner to keep reading this post and get 7 days of free access to the full post archives.